In the first instalment of this series, I briefly introduced orientational order in assemblies of anisotropic particles, and proposed an illustration based on synthetic microstructures. But what I really intend to do in this series is to show how orientational order can be quantified in a “real-life” sample, namely a packing of rice grains. This of course requires a 3D image of the packing. Fortunately, my lab (Laboratoire Navier) is the proud host of a collaborative microtomography platform and my former colleague Nicolas Lenoir – who was in charge of this instrument – gave me the opportunity to scan my toy sample in december 2013.
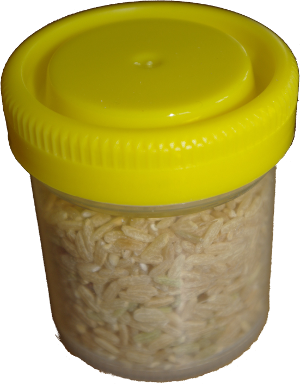
The sample preparation is rather crude. Ordinary, long-grain rice is poured in a plastic container (see picture below), 50mm in diameter. The average length of the grains is about 6.5mm as the image analysis to come will show. Therefore, strong boundary effects are to be expected. This is no big issue for the present study, which is carried out for illustrative purposes only.
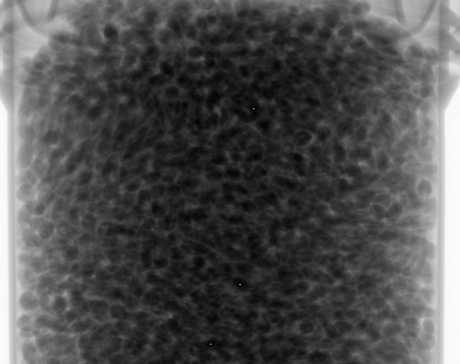
Two X-ray sources are available at Laboratoire Navier. For the present experiment, we used the Hamamatsu L10801 X-ray source (maximum voltage: 230V, maximum current: 1mA). Combined with the the Paxscan Varian 2520V flat-panel X-ray imager (1536x1920 pixels, pixel pitch 127µm), this setup leads to a voxel size of approx. 0.030mm. The specimen was scanned at 100kV and 300µA with an imager frame-rate of 6 images per second. To reduce noise, 12 radiographs were averaged to produce one projection; the total number of projections was 1440 (see below a typical projection).
3D reconstruction was carried out using standard tools developed by RX Solutions France. Contrast, resolution and signal-to-noise ratio were all excellent, so that the most basic reconstruction procedure resulted in very high quality 3D images (see three orthogonal slices below).
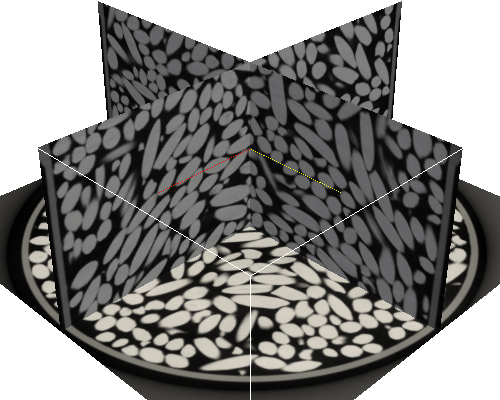
The reconstruction is highly contrasted, so that simple thresholding should produce a very convincing segmentation. This will be the topic of the next instalments. But we first take a break to discuss binning of the images.
Acknowledgements
The present series would not exist without the help of my former colleague Nicolas Lenoir, now research engineer at PLACAMAT. His dedication and excellent temper made 3D imaging at Laboratoire Navier a real delight. He also kindly agreed to review this post, which I am grateful for, since he spotted some rather crude mistakes!
Paraview was used to produce the last image of this post.
Update (2017-05-25)
The 3D reconstruction is now available from the Zenodo platform as a set of 689 TIFF images, 1747×1751 pixels, under a CC BY 4.0 license (10.5281/zenodo.582636).